Search

Software Engineer's Notes

Tag

Regression Testing

Claude Code UI Testing: Closing the Visual Feedback Loop with AEye Browser

How can I test UI with AEye Browser?

Claude Code is changing how software developers build applications. Instead of manually creating every component, service, test, and configuration file, developers can describe a feature in natural language and allow Claude Code to analyze the project, create an implementation plan, modify files, run commands, and fix errors.

This workflow can be especially powerful for frontend development. Claude Code can create React, Vue, Angular, JavaScript, TypeScript, HTML, and CSS components while considering the structure of the surrounding codebase.

However, building a user interface involves more than writing technically correct code.

A page can compile successfully and still contain:

  • Misaligned components
  • Overlapping text
  • Broken navigation
  • Buttons that cannot be clicked
  • Forms that do not submit
  • Poor mobile layouts
  • Missing error messages
  • Incorrect role permissions
  • Browser console errors
  • Accessibility violations
  • Missing SEO metadata

Claude Code can understand source code, but a user experiences the rendered application. This creates an important question:

How can Claude Code see, interact with, and test the interface it is building?

How Do We Develop User Interfaces with Claude Code?

Claude Code is an agentic development tool that can read a codebase, edit files, execute commands, and integrate with development tools. It can work across multiple files, follow project conventions, implement features, run tests, and fix failures.

A typical Claude Code frontend workflow may begin with a prompt such as:

Analyze the existing frontend architecture and create a responsive user profile page. Reuse the existing design system, form components, validation utilities, and API services. Include loading, empty, success, and error states.

Claude Code can then:

  1. Explore the project structure.
  2. Identify the framework and component conventions.
  3. Locate reusable UI components.
  4. Create or update the required files.
  5. Add API integration.
  6. Run the application build.
  7. Run linting and automated tests.
  8. Fix compilation or test failures.
  9. Present the code changes for review.

When used through the official Claude Code VS Code integration, developers can review Claude’s plans, inspect proposed changes in a side-by-side diff, reference selected files and line ranges, and accept or reject edits directly inside the IDE.

This creates a productive development loop:

Describe → Plan → Implement → Build → Review

The problem is that this loop does not automatically prove that the rendered interface looks and behaves correctly.

Source Code Correctness Is Not Visual Correctness

A frontend component can be logically valid while still producing a poor user experience.

Consider a registration page generated by an AI coding assistant. The code may:

  • Compile without errors
  • Send the correct API request
  • Validate required fields
  • Use the correct design-system components
  • Pass unit tests

Yet the rendered page may still have a submit button hidden below another element, an error message displayed outside the visible area, or a mobile menu that cannot be closed.

Traditional compiler output cannot detect most of these problems.

Unit tests can verify component logic, but they rarely show whether an interface is understandable, visually stable, or usable as a complete workflow.

This is why UI development requires a rendered feedback loop. The development agent needs access not only to the source code but also to the application as users experience it.

How Can We Test a UI Created with Claude Code?

A reliable UI testing strategy should use several complementary layers.

Component and Unit Tests

Component tests verify isolated behavior such as:

  • Whether a button emits the correct event
  • Whether validation messages appear
  • Whether a component renders the expected data
  • Whether state changes correctly
  • Whether callbacks are invoked

These tests are fast and useful, but they do not fully test the assembled application.

Integration Tests

Integration tests verify how components, APIs, routing, state management, and authentication work together.

For example, an integration test might confirm that submitting a profile form updates the user state and displays a success notification.

End-to-End Browser Tests

End-to-end tests interact with the application through a real browser.

They can verify workflows such as:

  • Registering a new account
  • Signing in
  • Resetting a password
  • Adding an item to a shopping cart
  • Completing a checkout process
  • Updating a profile
  • Verifying role-based permissions

Visual Inspection

A rendered screenshot can reveal problems that source-code analysis may miss:

  • Spacing inconsistencies
  • Truncated labels
  • Overflow
  • Missing icons
  • Unexpected wrapping
  • Broken responsive layouts
  • Poor contrast
  • Invisible controls

Accessibility Testing

Accessibility testing checks whether the application can be used by people with different abilities. This can include identifying missing labels, invalid heading structures, keyboard-navigation problems, contrast issues, and incorrect ARIA attributes.

Technical SEO Testing

For public web pages, UI verification should also include technical SEO checks such as:

  • Page titles
  • Meta descriptions
  • Canonical URLs
  • Viewport configuration
  • Heading structure
  • Image alternative text
  • Open Graph metadata
  • Structured data

A mature workflow combines these layers rather than depending on a single test type.

How Should UI Issues Be Reported to Claude Code?

Claude Code can fix UI problems more effectively when the issue report includes specific evidence.

A weak issue report might say:

The page looks wrong. Fix it.

A stronger issue report includes:

  • The affected route
  • The browser viewport
  • The user role
  • Reproduction steps
  • Expected behavior
  • Actual behavior
  • Screenshots
  • Browser console errors
  • Relevant response information
  • Acceptance criteria

For example:

Open /account/profile using a 390 × 844 mobile viewport. Sign in as a standard user and select Edit Profile. The Save button overlaps the phone-number validation message after an invalid number is entered. The validation message should appear above the button with at least 16 pixels of spacing. Inspect the rendered page, identify the CSS rule causing the overlap, fix it, and verify the page again at mobile and desktop sizes.

This gives Claude Code enough information to reproduce the issue, identify the responsible code, implement a targeted fix, and verify the result.

The difficulty is collecting all this information manually. Developers may need to take screenshots, copy console errors, inspect elements, record the viewport, describe interactions, and paste everything into the Claude Code conversation.

A browser-testing extension can make that feedback loop much more direct.

Does Claude Code Already Support Browser Interaction?

Claude Code can be connected to external tools through the Model Context Protocol, or MCP. MCP servers give Claude Code access to tools, APIs, databases, and other systems instead of requiring developers to manually copy information into a conversation.

Anthropic also documents a Chrome integration that lets Claude Code test web applications, read console information, and automate browser workflows from VS Code. That integration can share the login state of the developer’s Chrome browser.

However, teams may still want a testing workflow that is:

  • Isolated from the developer’s everyday browser
  • Associated with a specific project
  • Based on Playwright and Chromium
  • Capable of saving reusable test cases
  • Visible and manageable from VS Code
  • Designed for repeatable regression testing
  • Able to generate persistent reports
  • Suitable for role-based testing
  • Able to run accessibility and SEO checks

This is the specific workflow addressed by AEye Browser.

What Is AEye Browser?

AEye Browser Marketplace

AEye Browser is a free and open-source VS Code extension created by Aesepus Technology for Claude Code workflows.

It gives Claude Code access to a private, Playwright-driven Chromium browser through an MCP server. The browser uses an isolated profile with its own cookies and login state rather than depending on the developer’s normal browser profile.

Through AEye Browser, Claude can:

  • Navigate to application pages
  • Click buttons and links
  • Fill in forms
  • Capture screenshots
  • Read the DOM
  • Inspect cookies
  • Inspect response headers
  • Review browser console errors
  • Create reusable test cases
  • Run individual tests
  • Run regression suites
  • Test as different user roles
  • Run accessibility scans
  • Run technical SEO audits
  • Create and preview page mockups

The extension also provides VS Code panels and a status-bar menu so developers can inspect tests, run them manually, open reports, edit configuration, and manage test users without communicating through Claude for every operation.

In other words, AEye Browser helps close the loop between the code Claude writes and the page that actually renders.

Why Use an Isolated Browser?

Allowing an AI agent to control a developer’s everyday browser can create unnecessary risk and unpredictability.

A normal browser may contain:

  • Personal accounts
  • Production sessions
  • Saved cookies
  • Administrative access
  • Private browsing history
  • Extensions that modify pages
  • Unrelated open tabs

AEye Browser uses a persistent but isolated Chromium profile. It is separate from the developer’s normal browsing environment while still allowing a project’s testing session to preserve cookies and login state.

Developers should still use dedicated test accounts and non-production environments. Production credentials, real customer information, and privileged administrative accounts should not be used for AI-assisted UI testing.

Reusable UI Test Cases

Raw browser interaction is useful during development, but repeatability is what turns an experiment into a testing process.

AEye Browser allows Claude to create named JSON test cases and run them individually or as a complete suite. It generates self-contained HTML pass-or-fail reports, and a failing element can be highlighted in the associated screenshot.

Each test also has a plain-text companion file with a notes section that developers can edit. This gives the team a human-readable explanation alongside the machine-readable test definition.

A developer could ask Claude:

Use AEye Browser to create a reusable regression test for the login page. Test a successful login, an invalid password, a missing email address, and the account-lockout message. Run the test and summarize all failures.

The test can then be reviewed, rerun, and expanded as the application changes.

Role-Based UI Testing

Applications often display different controls based on the signed-in user’s permissions.

For example:

  • Administrators may delete records.
  • Editors may update records.
  • Viewers may only read records.
  • Anonymous users may be redirected to the login page.

AEye Browser supports named test-user profiles and can repeat a saved test for multiple users. This makes it possible to ask Claude to verify that a viewer cannot see an administrative action while an administrator can access it.

An example prompt is:

Create a test for the user-management page. Run it as an administrator, editor, and viewer. Verify that only the administrator can see and use the Delete User button. Provide screenshots and a result for each role.

Role-based testing is especially useful for applications with complex authorization rules because backend permission checks and frontend visibility rules must remain consistent.

Accessibility and SEO Checks

AEye Browser includes an accessibility check based on axe-core. The scan reports WCAG-related violations by impact level. It can be run independently or included as a step in a reusable test.

For example:

Navigate to the checkout page and run an accessibility scan. Group the findings by severity, explain which components are affected, fix all critical and serious violations, and run the scan again.

The extension also includes a technical SEO audit covering items such as titles, meta descriptions, canonical tags, viewport configuration, headings, alternative text, Open Graph data, and structured data.

An example SEO prompt is:

Run an AEye Browser technical SEO check on the homepage and product pages. Identify missing metadata, heading problems, images without alternative text, and structured-data issues. Fix the findings and repeat the audit.

These tools do not replace a complete accessibility review or SEO strategy, but they can identify common problems before code reaches production.

Page Mockups and Responsive Previews

AEye Browser can also save self-contained HTML and CSS mockups. Claude can preview a mockup and capture desktop, tablet, and mobile screenshots in one operation.

This supports a design-first workflow:

Create a mockup for a SaaS pricing page with three plans, a monthly-versus-annual selector, a feature comparison section, and a frequently asked questions section. Preview it at desktop, tablet, and mobile sizes.

After reviewing the screenshots, the developer can ask Claude to refine the design before integrating it with the application’s framework and backend services.

How to Install AEye Browser in VS Code

The easiest installation method is through the Visual Studio Marketplace:

Install AEye Browser from the Visual Studio Marketplace

You can install it using either of the following methods.

Install from the Marketplace Website

  1. Open the AEye Browser Marketplace page.
  2. Select Install.
  3. Allow the browser to open Visual Studio Code.
  4. Confirm the extension installation in VS Code.
  5. Open the workspace containing your web application.

Install from the VS Code Extensions Panel

  1. Open Visual Studio Code.
  2. Open the Extensions view using Ctrl+Shift+X on Windows or Linux, or Cmd+Shift+X on macOS.
  3. Search for AEye Browser.
  4. Confirm that the publisher is Aesepus Technology.
  5. Select Install.
  6. Reload VS Code when requested.

AEye Browser requires Node.js 18 or later and VS Code 1.90 or later. It supports Windows, macOS, and Linux. The current Claude Code VS Code documentation requires VS Code 1.94 or later, so using VS Code 1.94 or newer satisfies the requirements of both extensions.

First-Time Project Setup

AEye Browser must be configured once for each project workspace.

Step 1: Open the Project

Open the root workspace of the web application in VS Code.

The application should have a local or test URL that the browser can access, such as:

http://localhost:3000

Step 2: Set Up the Workspace

Click the AEye Browser status-bar button or open the VS Code Command Palette.

Run:

AEye Browser: Set Up Workspace

This creates an AEyeBrowser/ folder in the workspace and installs the Chromium browser required by Playwright.

Step 3: Configure the MCP Server

Run:

AEye Browser: Configure MCP Server

This creates or updates the project’s .mcp.json file so Claude Code can discover and communicate with the AEye Browser MCP server.

Step 4: Start Claude Code

Start a new Claude Code session in the workspace.

Claude Code should detect the aeyebrowser MCP server. Review and approve the connection when prompted. After approval, you can ask Claude to use the browser through normal conversational prompts.

Configuring the Application URL

Open the AEye Browser status-bar menu and select:

AEye Browser: Open Configuration

From the configuration area, you can manage settings such as:

  • Base application URL
  • Browser viewport
  • Headless mode
  • Test-user profiles
  • Page mockups

The configuration is stored at the project level, allowing different applications to use different URLs and browser settings.

For example, a local configuration might use:

  • Base URL: http://localhost:3000
  • Viewport width: 1280
  • Viewport height: 720
  • Headless: false

Using a visible browser during initial development can make debugging easier. Headless execution may be more suitable for repeatable automated runs.

How to Use AEye Browser with Claude Code

After setup, start the application’s local development server and ask Claude Code to inspect it.

Basic Visual Inspection

Use AEye Browser to open the homepage. Capture desktop and mobile screenshots. Identify layout, spacing, readability, and responsive-design problems. Do not modify the code until you summarize the issues.

Console and Runtime Error Check

Navigate through the homepage, pricing page, registration page, and dashboard. Check the browser console after each page. Report JavaScript errors and warnings, identify their source files, and fix the application errors.

Form Testing

Test the registration form with valid data, missing required fields, an invalid email address, mismatched passwords, and an existing account. Verify the visible validation messages and create a reusable test case.

Responsive Testing

Inspect the navigation menu at widths of 1440, 1024, 768, 390, and 320 pixels. Verify that all links remain accessible and that the mobile menu opens and closes correctly.

Regression Testing

Create reusable AEye Browser tests for login, logout, password reset, profile update, and session expiration. Run all tests and open the latest report.

Accessibility Testing

Run an accessibility scan on every public page. Fix critical and serious findings, rerun the scans, and summarize any remaining issues that require a design decision.

SEO Testing

Audit the public pages for title, meta description, canonical URL, viewport, heading structure, image alternative text, Open Graph metadata, and structured data. Create a prioritized issue list before making changes.

AEye Browser can navigate, interact with elements, capture screenshots, inspect page information, create tests, manage users, perform audits, and preview mockups through its MCP tools.

Reviewing Tests and Reports Without Claude

Developers do not have to use Claude Code to inspect every AEye Browser artifact.

The AEye Browser status-bar menu includes options such as:

  • Open Configuration
  • Browse Tests
  • Open Latest Report
  • Set Up Workspace
  • Configure MCP Server
  • About

The Browse Tests panel shows saved tests and their most recent pass-or-fail status. Developers can run a test manually, open its report, read or update its notes, or delete it. Panel-triggered tests use a separate browser profile, allowing them to run without conflicting with a Claude-controlled browser session.

This visibility is important because AI-generated tests should remain understandable and reviewable by humans.

The AEye Browser GitHub Repository

The AEye Browser source code is publicly available in the official GitHub repository:

AEye Browser GitHub Repository

The repository contains the VS Code extension host, MCP server, browser-management code, test runner, report generator, accessibility scanner, SEO auditor, configuration storage, user-profile management, mockup support, and individual MCP tool implementations. The project is published under the MIT license.

The repository is useful for developers who want to:

  • Review how the extension works
  • Inspect its security model
  • Understand the MCP implementation
  • Report bugs through GitHub Issues
  • Suggest new features
  • Contribute improvements
  • Compile the extension locally
  • Create a custom VSIX package
  • Learn how a VS Code extension can expose Playwright tools through MCP

To compile the project locally, the repository documents the following commands:

npm install
npm run compile

For iterative development, it also provides:

npm run watch

A deployable VSIX package can be created with:

npm run package

The generated package can then be installed locally with the VS Code command-line interface.

Most users should install the official Marketplace version. The GitHub workflow is primarily useful for contributors, extension developers, and teams that need to inspect or customize the source.

Integrating AEye Browser into the Software Development Process

AEye Browser should not be treated as a tool used only after development is complete. It can be integrated throughout the software development lifecycle.

1. Requirements and Acceptance Criteria

Convert each UI requirement into observable behavior.

Instead of writing:

Create a profile page.

Write:

A signed-in user can view and update their name, phone number, and profile image. Invalid values display accessible inline errors. The page must work at mobile and desktop sizes.

These acceptance criteria can later become browser tests.

2. Design and Prototyping

Use the mockup feature before building complex pages.

Ask Claude to:

  • Create alternative layouts
  • Preview responsive breakpoints
  • Compare navigation structures
  • Review content hierarchy
  • Identify accessibility risks

Once the design is accepted, Claude can implement it using the project’s actual framework and component library.

3. Feature Development

During implementation, use a short feedback cycle:

Implement → Render → Inspect → Fix → Retest

After Claude modifies a UI component, ask it to open the rendered page and verify the result rather than stopping after a successful build.

4. Definition of Done

Add UI verification requirements to the team’s definition of done.

For example:

  • Application builds successfully
  • Unit and integration tests pass
  • Main user flow passes in AEye Browser
  • No unexpected browser console errors remain
  • Desktop and mobile layouts are reviewed
  • Critical accessibility issues are resolved
  • Public pages pass basic technical SEO checks
  • Test evidence is available in the generated report

The project’s CLAUDE.md file can also document these expectations so Claude Code applies them consistently. Anthropic documents CLAUDE.md as a project-level place for coding standards, architectural decisions, preferred libraries, and repeatable instructions.

An example instruction is:

For every user-interface change:
1. Run the application locally.
2. Use AEye Browser to inspect the affected route.
3. Test the primary success and failure paths.
4. Check the browser console.
5. Capture desktop and mobile screenshots.
6. Run an accessibility check.
7. Update or create a reusable regression test.
8. Do not mark the task complete until the rendered interface has been verified.

5. Pull Request Review

Before opening a pull request, ask Claude Code to run the relevant browser tests and summarize the results.

The pull request can include:

  • Tested routes
  • User roles tested
  • Viewports tested
  • Accessibility findings
  • Known limitations
  • Generated report location
  • Screenshots of important states
  • Tests added or updated

The generated output should support human review rather than replacing it.

6. Regression Testing

When a bug is discovered, first create a test that reproduces it.

The workflow becomes:

  1. Reproduce the UI problem.
  2. Save it as a regression test.
  3. Confirm that the test fails.
  4. Ask Claude Code to fix the problem.
  5. Run the test again.
  6. Keep the test to prevent the problem from returning.

This is one of the most valuable ways to turn AI-assisted debugging into a repeatable engineering process.

7. Continuous Integration

AEye Browser is primarily designed for an interactive VS Code and Claude Code workflow.

Teams should continue using established CI tools such as Playwright, Cypress, unit-test frameworks, linters, and build pipelines for mandatory automated checks. AEye Browser can serve as a local visual-development and regression layer, while the most critical scenarios are also represented in the project’s CI suite.

AI-assisted browser testing should complement—not eliminate—deterministic automated testing and human exploratory review.

Recommended Team Workflow

A practical development workflow could look like this:

  1. Create a feature branch.
  2. Define UI acceptance criteria.
  3. Ask Claude Code to analyze the existing architecture.
  4. Create a mockup when the design is uncertain.
  5. Implement the feature.
  6. Start the local application.
  7. Use AEye Browser to inspect the rendered page.
  8. Test success, failure, loading, and empty states.
  9. Review console errors and response behavior.
  10. Test desktop and mobile layouts.
  11. Run accessibility and SEO checks where applicable.
  12. Create or update reusable regression tests.
  13. Review the generated report.
  14. Run the project’s normal automated test suite.
  15. Open a pull request with testing evidence.
  16. Complete a human code and UI review.

Limitations and Responsible Use

AEye Browser improves Claude Code’s ability to verify rendered applications, but it does not replace every testing activity.

Developers still need to perform:

  • Human usability reviews
  • Cross-browser testing beyond Chromium
  • Performance testing
  • Security testing
  • Backend authorization testing
  • Production monitoring
  • Device testing
  • Manual accessibility testing
  • Automated CI validation

A passing browser test only proves that the tested scenario passed under the tested conditions.

Teams should also avoid placing production credentials or real customer information in test-user profiles. Dedicated test accounts, sanitized datasets, local environments, and staging systems are safer choices.

Conclusion

Claude Code can generate interfaces quickly, but source-code generation is only part of frontend development.

The real product is the page that users see and interact with.

A complete AI-assisted UI workflow needs a way to connect implementation with rendered behavior. Developers should be able to ask Claude Code to open the application, navigate through workflows, inspect visual output, review console errors, test multiple roles, run accessibility checks, generate reports, and verify that a fix actually works.

AEye Browser provides this connection through a private Playwright and Chromium environment, an MCP server, reusable test cases, VS Code panels, role-based testing, accessibility scanning, technical SEO auditing, mockup previews, and human-readable reports.

You can learn more from the following official resources:

By integrating rendered-page verification into everyday development, teams can move from asking Claude Code only to write a user interface to asking it to demonstrate that the interface actually works.

Regression Testing: A Complete Guide for Software Teams

What is Regression Testing?

What is Regression Testing?

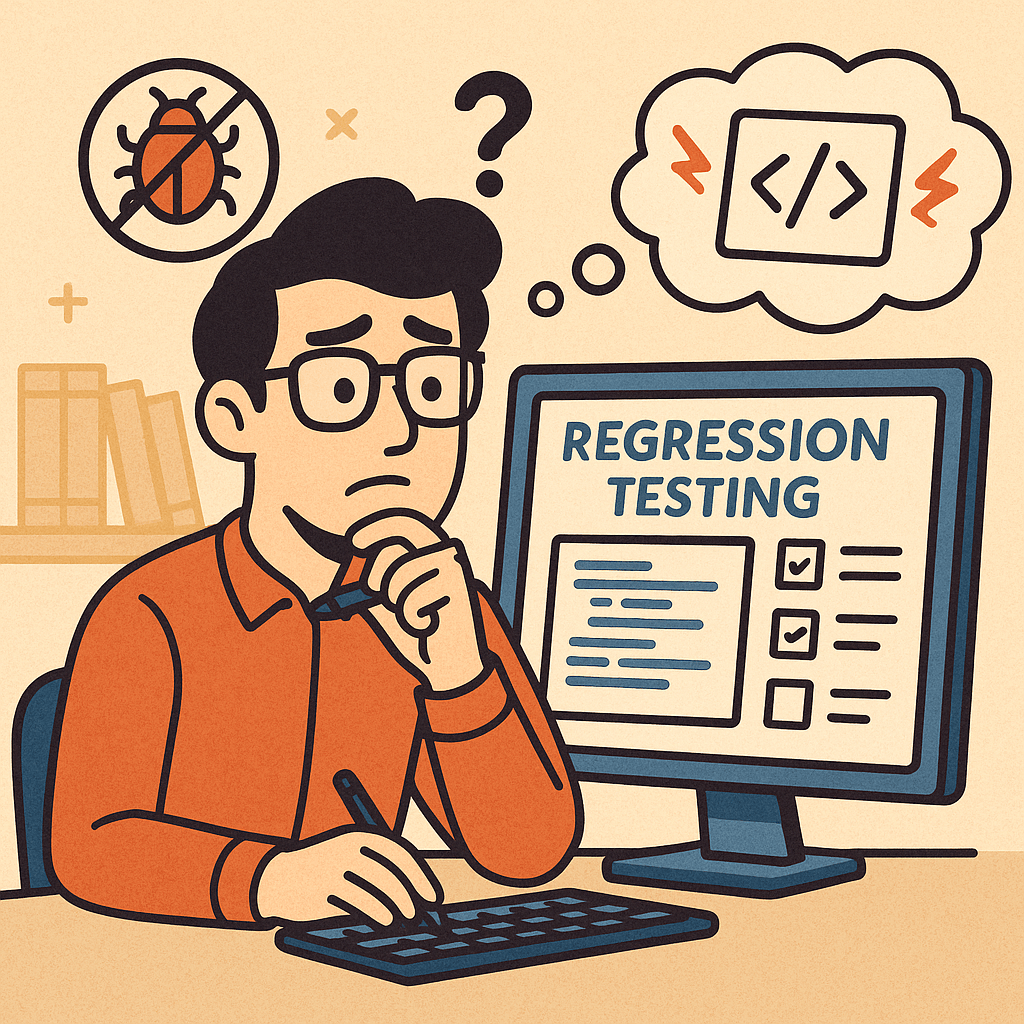
Regression testing is a type of software testing that ensures recent code changes, bug fixes, or new features do not negatively impact the existing functionality of an application. In simple terms, it verifies that what worked before still works now, even after updates.

This type of testing is crucial because software evolves continuously, and even small code changes can unintentionally break previously working features.

Main Features and Components of Regression Testing

  1. Test Re-execution
    • Previously executed test cases are run again after changes are made.
  2. Automated Test Suites
    • Automation is often used to save time and effort when repeating test cases.
  3. Selective Testing
    • Not all test cases are rerun; only those that could be affected by recent changes.
  4. Defect Tracking
    • Ensures that previously fixed bugs don’t reappear in later builds.
  5. Coverage Analysis
    • Focuses on areas where changes are most likely to cause side effects.

How Regression Testing Works

  1. Identify Changes
    Developers or QA teams determine which parts of the system were modified (new features, bug fixes, refactoring, etc.).
  2. Select Test Cases
    Relevant test cases from the test repository are chosen. This selection may include:
    • Critical functional tests
    • High-risk module tests
    • Frequently used features
  3. Execute Tests
    Test cases are rerun manually or through automation tools (like Selenium, JUnit, TestNG, Cypress).
  4. Compare Results
    The new test results are compared with the expected results to detect failures.
  5. Report and Fix Issues
    If issues are found, developers fix them, and regression testing is repeated until stability is confirmed.

Benefits of Regression Testing

  • Ensures Software Stability
    Protects against accidental side effects when new code is added.
  • Improves Product Quality
    Guarantees existing features continue working as expected.
  • Boosts Customer Confidence
    Users get consistent and reliable performance.
  • Supports Continuous Development
    Essential for Agile and DevOps environments where changes are frequent.
  • Reduces Risk of Production Failures
    Early detection of reappearing bugs lowers the chance of system outages.

When and How Should We Use Regression Testing?

  • After Bug Fixes
    Ensures the fix does not cause problems in unrelated features.
  • After Feature Enhancements
    New functionalities can sometimes disrupt existing flows.
  • After Code Refactoring or Optimization
    Even performance improvements can alter system behavior.
  • In Continuous Integration (CI) Pipelines
    Automated regression testing should be a standard step in CI/CD workflows.

Real World Use Cases of Regression Testing

  1. E-commerce Websites
    • Adding a new payment gateway may unintentionally break existing checkout flows.
    • Regression tests ensure the cart, discount codes, and order confirmations still work.
  2. Banking Applications
    • A bug fix in the fund transfer module could affect balance calculations or account statements.
    • Regression testing confirms financial transactions remain accurate.
  3. Mobile Applications
    • Adding a new push notification feature might impact login or navigation features.
    • Regression testing validates that old features continue working smoothly.
  4. Healthcare Systems
    • When updating electronic health record (EHR) software, regression tests confirm patient history retrieval still works correctly.

How to Integrate Regression Testing Into Your Software Development Process

  1. Maintain a Test Repository
    Keep all test cases in a structured and reusable format.
  2. Automate Regression Testing
    Use automation tools like Selenium, Cypress, or JUnit to reduce manual effort.
  3. Integrate with CI/CD Pipelines
    Trigger regression tests automatically with each code push.
  4. Prioritize Test Cases
    Focus on critical features first to optimize test execution time.
  5. Schedule Regular Regression Cycles
    Combine full regression tests with partial (smoke/sanity) regression tests for efficiency.
  6. Monitor and Update Test Suites
    As your application evolves, continuously update regression test cases to match new requirements.

Conclusion

Regression testing is not just a safety measure—it’s a vital process that ensures stability, reliability, and confidence in your software. By carefully selecting, automating, and integrating regression tests into your development pipeline, you can minimize risks, reduce costs, and maintain product quality, even in fast-moving Agile and DevOps environments.

Powered by WordPress.com.

Up ↑